Table of Contents
1. Introduction
Abstract
In the past, when buying an item, one had to trust reviews in newspapers or from friends. In today’s age, with online shopping, we have to tap into the minds of thousands of people who have purchased the product we are thinking about. With the help of Amazon reviews and their star-system, we can easily analyse how good the product likely is. But while a newspapers or professional reviewer is generally working hard for consistency and unbiasedness, these facts are not given for a general public reviewer writing a comment. With the help of the Amazon review dataset, we will try to find bias in the reviews, in order to possibly give an idea on whether or not, and if so how, to correct a bias. We will be especially interested in the influence of the following factors on the number of stars given:
- The date the review was written on
- The category of the product the review was written for
- The country of residence of the buyer (for instance, was the product bought on Amazon US or Amazon UK?)
- The past ratings from the reviewer
Dataset
We will use the Amazon Customer Reviews Dataset that consist of many millions of Amazon reviews. More precisely, it contains (amongst other information that will not be used) the following information for each review:
marketplace: The “country of Amazon”. Data is available for the United States, United Kingdom, France, Germany and Japancustomer_id: A unique id representing the user who wrote the reviewproduct_id: A unique id representing the product reviewsproduct_title: The name of the productproduct_category: The category of the product. The following categories are available: Wireless, Watches, Video Games, Video DVD, Video, Toys, Tools, Sports, Software, Shoes, Pet Products, Personal Care Appliances, PC, Outdoors, Office Products, Musical Instruments, Music, Mobile_Electronics, Mobile Apps, Major Appliances, Luggage, Lawn_and_Garden, Kitchen, Jewelry, Home Improvement, Home Entertainment, Home, Health Personal Care, Grocery, Gift Card, Furniture, Electronics, Digital Video_Games, Digital Video Download, Digital Software, Digital_Music_Purchase, Digital Ebook Purchase, Camera, Books, Beauty, Baby, Automotive and Apparelstar_rating: The number of stars given by the reviewer, between 1 and 5helpful_votes: Other users can vote on the usefulness of a review (either positive or negative). This represents the total number of positive votestotal_votes: This is the number of positive and negative votes combinedverified_purchase: If Amazon is able to check that you indeed bought this exact product, with the same price, your review will be marked as “verified”review_headline: Short summary of the reviewreview_body: Full content of the reviewreview_date: Date the review was posted on
Since we have a lot of data (amounting to ~20GB), our main focus will be on the reviews related to the Books. This is also by far the largest dataset and the one Amazon is most known for. We will do an in-depth analysis of these reviews, and then rapidly compare it to the other categories.
Research Questions
There are two main questions we will try to answer during this project:
- What factors influence the rating given in an Amazon review (other than product quality)?
- Is there a way to correct this bias, and should we correct this bias?
Motivation
Our goal is mostly to provide useful information to Amazon itself and to the products sellers. So that they can have a better idea of what a given review’s rating should really be. For instance, they might receive a very bad review from someone and not understand why they had such a bad rating. But after bias correction it could be possible that the reviewer is just a “hater” (someone who always gives bad rating to every product) and that instead of a one-two stars it could be worth a 3-4 stars. There could be other factors that influenced the rating of that review and we will try to best correct them to valuable information.
See more about that in the Usefulness section at the end of the webpage.
General Description of Data
Before focusing our study on Books only, we will take a quick look at the complete dataset, and see if we can see any interesting effect. We will, for each of the available category, look at the number of reviews available. Note however that this might not be entirely representative of the true repartition of the categories, since we do not know what process Amazon used to select those reviews.
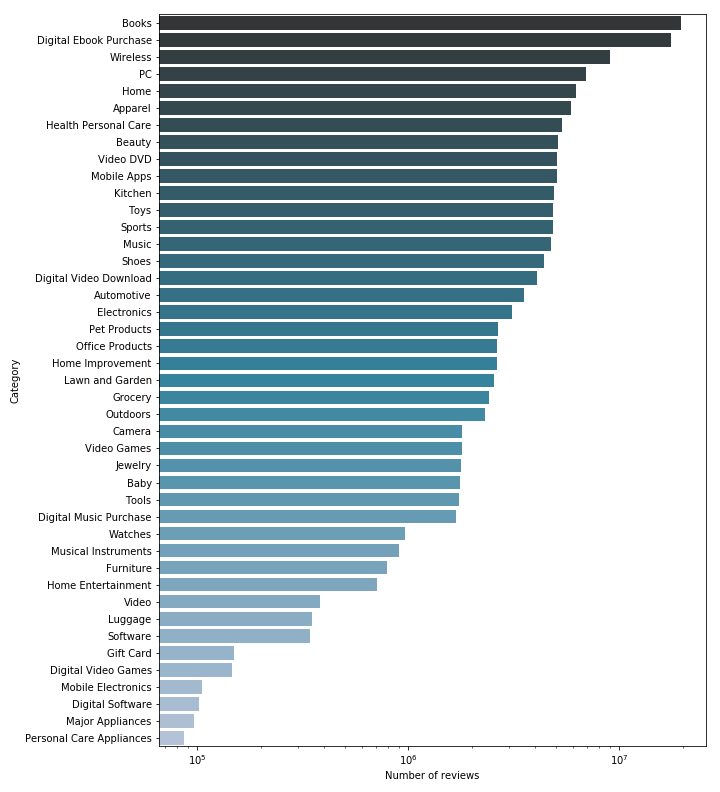
Note that we used a logratihmic scale, so the proportions are distorded. Indeed, some of the smallest categories (Digital Software, Major Appliance, Personnal Care Appliance for instance) have so few reviews compared to the larger ones (Books, Ebooks, Wireless) that they would be invisible on a linear scale. The results are mostly expected, although some categories are ranked higher than one might expect them to be (e.g. Video DVD, when they mostly have been replaced by streaming services, or Wireless that is ranked way higher than Electronics, even if it should not if the true proportions were respected since Wireless is clearly a more specific category, with less products.
We also took a quick look at the average rating (the number of stars given by the reviewers) of each category.
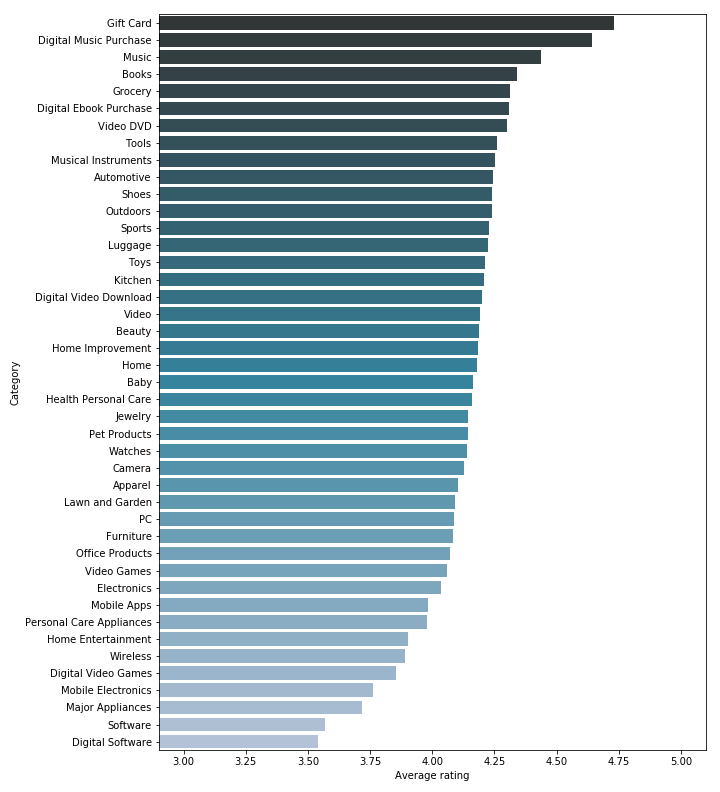
As you can see, there is quite a non negligible difference between the highest and lowest rated category. The rating for the top three categories (Gift Card, Digital Music and Music) is expected, since it is quite hard to find negative points about a gift card (it cannot really differ from the promised product, unless there is some kind of error with the card, like having been sent a damaged one). And for the Music categories, people usually know what artist they like, and they probably will not be surprised by the quality of the product.
We can also find some logical explanations for the lowest ranked categories. Software and Digital Software are clearly more niche products, often with a higher price tag, intended for businesses or professional individuals. Because of the type of product, it is also way harder to know exactly what to expect (you will not be able to judge the quality of a software by looking at screenshots, notably you will not see any bugs that might affect your experience negatively). You will more frequently be disappointed when your expensive software does not work as expected, and you can not just use the warranty to exchange it with a better one.
To answer to our main question: Is there some bias and should we correct it?, we think that indeed there is some (people are clearly biased because they buy music that they know they will probably like), but it also seems possible that some categories (mainly Software) are really of worse quality than others. For this reason, when we will try to correct bias later, we will only do it for one category, independently from the others.
We will now, for the Books, take a deeper look at some of the features available.
2. Effects on Rating
This part will be separated in two. We will first do an analysis by category (as said before in depth for the Books, and then compared to other categories), and then by country.
By Product Category
First, we will analyse some of the features (verified_purchase, helpful_votes, total_votes, review_date, number of reviews per product, review_headline and review_body), then we are going to discuss their potential influence in the bias, and if they should be considered, and finally we will compare the results with the other categories.
Analysis of some features
Analysis of the verified_purchase feature
This feature might have an influence, since non-verified purchases might not be as reliable since poeple might not have actually bought the product. We have splited the dataset into verified and non-verified purchases, and for each category we plot the average rating per year, and the number of reviews per year.
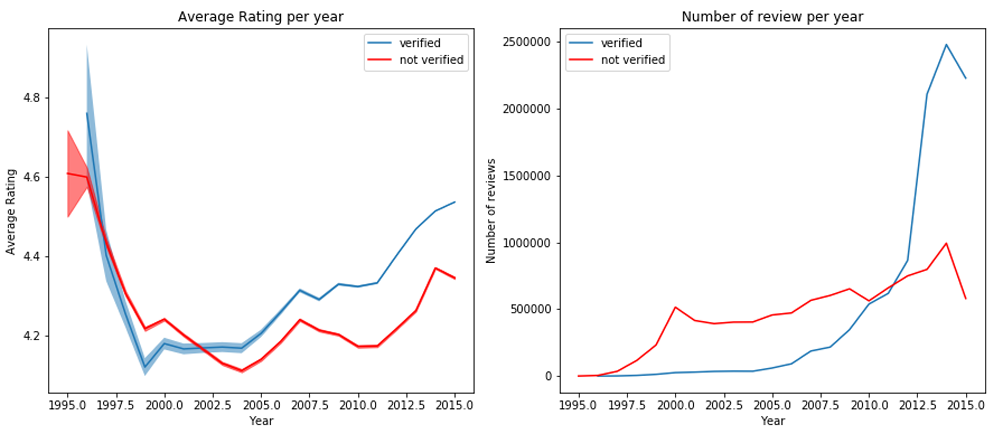
We can clearly see, with a 95% confidence interval (in light blue), that the average rating is higher for verified reviews in recent years. It is difficult to guess what could have caused it to change along the years, possibly one or more changes in the condition to be a verified purchase. It would be good to ignore all unverified reviews, to have more reliable ratings.
There is however a problem with this approach. By looking at the evolution of the number of reviews over the years, we realize that in the earliest years there are almost no verified reviews. This might be correlated to the fact that this functionality was added quite late, or that maybe it used to be harder to be a verified review. Hence, we decided, despite the difference of rating, to keep all reviews, in order to avoid losing most of the data for the earliest years. It is clear that we would miss a big share of the data from the 2000’s if we limit ourselves to the verified reviews. From now on, we will use all the data.
Since we are keeping this feature, and we saw it is not negligable, it will be taken into account when applying our bias correction later on.
Analysis of the helpful_votes and total_votes features
We want to see if the upvoted ratio on reviews in correlated to the rating given by the review. For the helpful ratio to make some sense, and for it to be representative enough of the quality of a review, we decided to only keep the reviews with at least 10 votes.
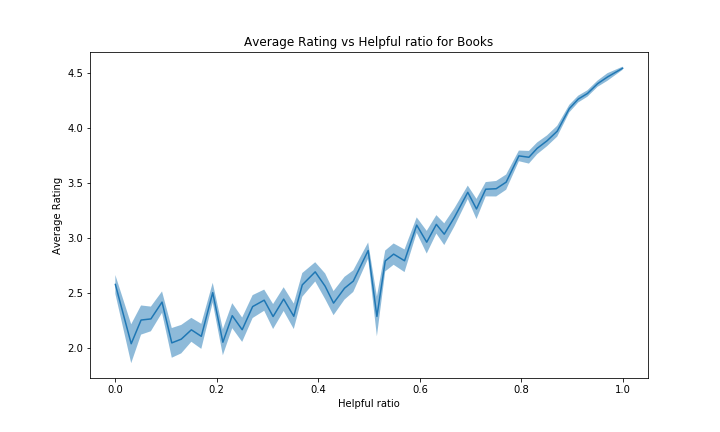
We can see that people tend to give more positive votes than negatives ones on reviews. Possibly as the users tend to give good reviews on Books (~4.3/5 on Books and overall good ratings on other categories as well), they will also tend to positively rate other things such as other people’s reviews. One could also interprete this as people’s lazyness, who only rate reviews when they find them useful, and not otherwise.
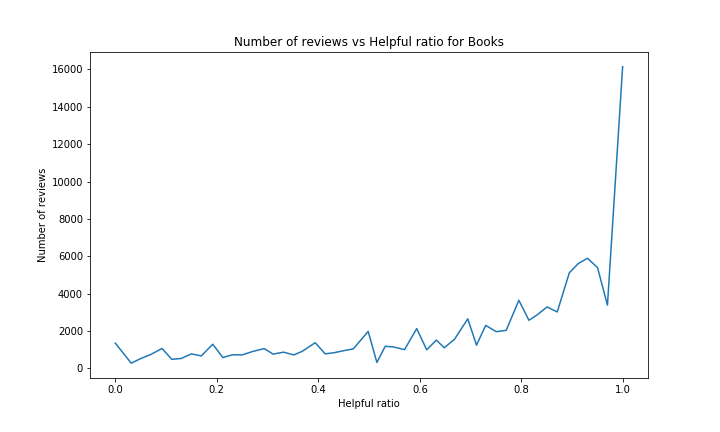
This graph may seem a bit strange at first, wondering why people would mostly positively rate reviews with high ratings only. However it can easily be explained: on any product it makes sense to assume a user will usually give a positive vote to a review if it is somewhat close to that user opinion on the product. And since the average in Books is very high, most of the reviews with high ratings will be close to the product average on average, meaning the closer a review’s rating is close to the general opinion (= product average), the more likely it is to get positive votes.
A similar explanation can be applied in a reversed way for reviews with lows ratings that tend to have lower helpful ratio.
To try to correct bias later, we can use this helpful ratio to indicate how much a review should be trusted and less biased corrected. The higher helpful ratio it has, the more probable it gets to be what the average person thinks, hence not needing bias correction.
When looking at the graphs of the other categories, we observe a similar trend for almost all of them. For each category in the above graphe, we indeed have a positive slope, similar to Books. For some of them the confidence interval is quite big, but not too much too be able to draw these conclusions.
However, the categories with a bad average rating (such as Digital Software with average ~3.55/5 and Software) will have a more flat or even reversed curve. It can be explained by the same kind of reasoning but inversed: reviews with high rating will be far from the average product rating, hence people will view the review as less accurate. Note that there probably are other unknown effects in place to explain such negativity in this case. See figure below for Digital Software and Software:
Analysis of the review_date feature
We now would like to know if the day the review was posted on has any influence on the rating. Moreover, it would be interesting to look for a potential influence from the hour of the day the review was written at, but we don’t have access to this information. Therefore we decided to split the data according to four different time metrics: by Year, by Month, by Day of Month and by Day of Week.
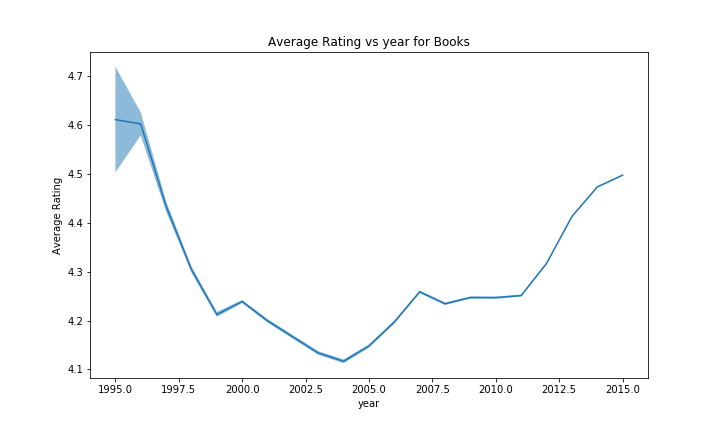
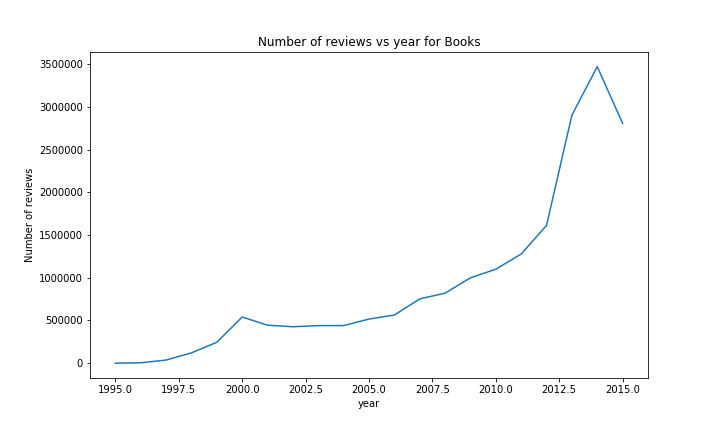
For analysing the effect of the year the confidence bands are very tight for the rating, which is nice for drawing conclusions. We can see that the confidence bands widen for early years, here there are less reviews. We clearly see a decrease in the years up until ~2003 in the ratings. Afterwards the ratings increase. An second smaller drop can also be seen in ~2007. The number of reviews per year is clearly increasing, which is not surprising since amazon has been growing steadily. We observe a slight decrease after the year 2000, this may be attributed to a decrease in interest in internet companies after the dotcom bubble. The last drop around 2014-2015 is simply due to the missing data after july 2014.
When comparing the evolution of the rating with the year for the other catgeories, we do observe a similar effect.
For some of the categories, the effect is harder to see due to the larger scale caused by the first few uncertain years, but we can still recognize the drop in rating in 2004-2005 before climbing again, followed by a second smaller drop in 2007-2008, and then a tendancy to increase. However, we could not identify any outlier to this trend with enough evidence, those that had some variation often didn’t had a lot of products, making the results uncertain.
When looking at the number of reviews, a similar result can been seen with most of the categories; an almost exponetial growth, with at the end for some categories a little drop / flat, due to the year not being over.
There are however a few exceptions. The most notable ones are Music and Video. The rise in Music sales started earlier than most of the other categories (in ~1999), but was quickly stopped a year later. We could imagine that this was due to the Launch of iTunes around that time or the rise and fall of the dotcom bubble.
Now, let’s look at the months!
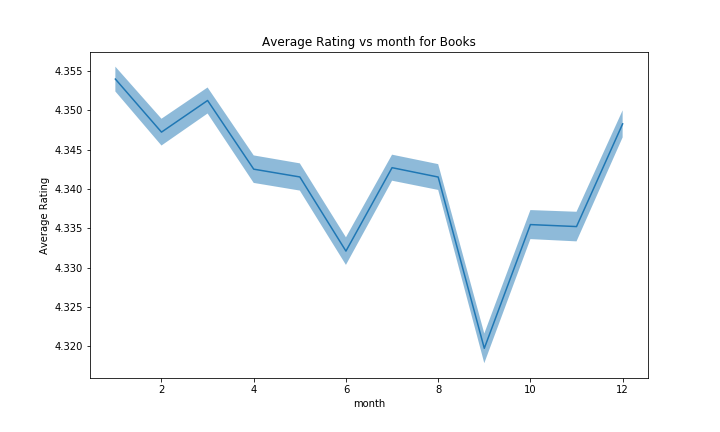
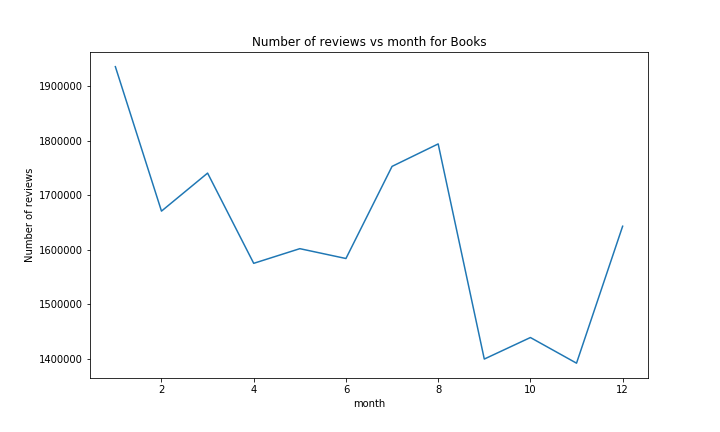
We can observe that the confidence bands for the average rating by month are quite tight. This allows us to draw conclusions with confidence. For the total number of reviews, however, we can not draw confidence bands. The number of reviews seems to have a general correlation with holidays. There is roughly a peak during the summer and one in the winter. The peak in the summer can be attributed to the fact that people have more time then, so they read more. Similarly, the peak in the winter (More specificaly in january) might correspond to people rating their Christmas presents. Note however that the reviews of the dataset range from may 1996 to july 2014. The lower values in the fall might also be partialy related to the fact that we do not have the data for fall 2014, but this alone should not have that much influence over all the years.
We also see that the ratings are higher during holiday season. This we attribute to the people being happier then. On the opposite, the lower ratings in semptember-october-november could be connected to the bad mood of people due to the autumn’s bad weather. It has to be noted that the effect is very small (about 0.03), but neverthesless statistically significant considering the amount of data available.
Now, let’s look at the rating and number of reviews compared to the day of the week
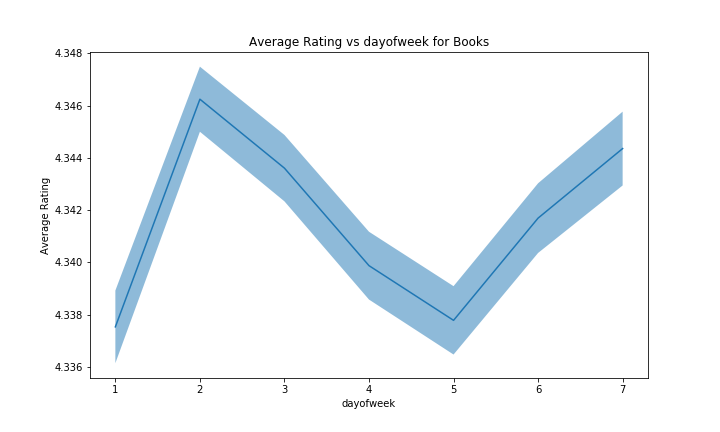
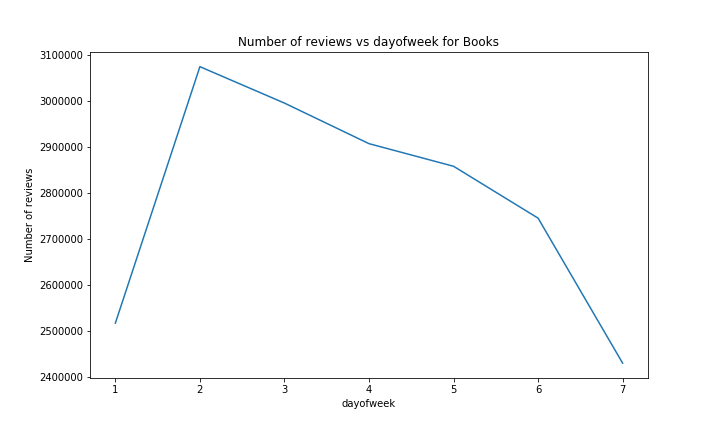
For the days of the week, we can see that here, the confidence bands are wider. It has to be noted that in the weekday-system used here, the week starts at Sunday. Notably, we have a spike in ratings on monday, which is surprising as we would expect people not to be at their happiest on mondays. The number of ratings starts high at the beginning of the week, and then steadily decreases until the weekend where it is at its lowest point. We may assume that people use / test their new products during the weekend, and give it a rating the following week after, mainly on monday because they don’t have the motivation to work. Here again, the effect on the average rating is statistically significant, but very small (in the order of 0.01).
However, when we compare this with the other categories, it becomes harder to validate our theory, since it is not present in all of them, which makes us think that the efect is more due to randomness than to any real factor.
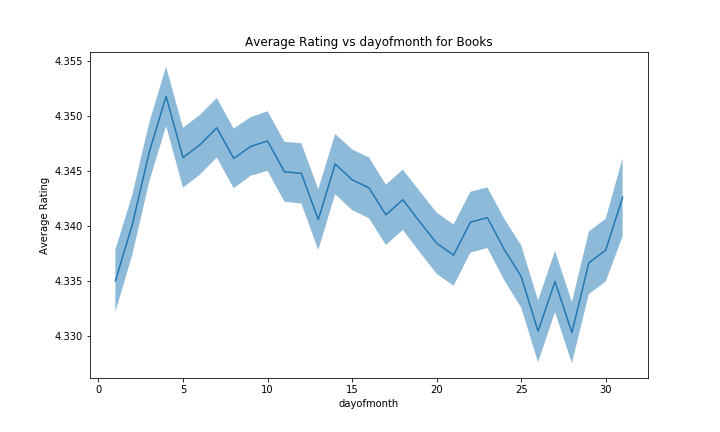
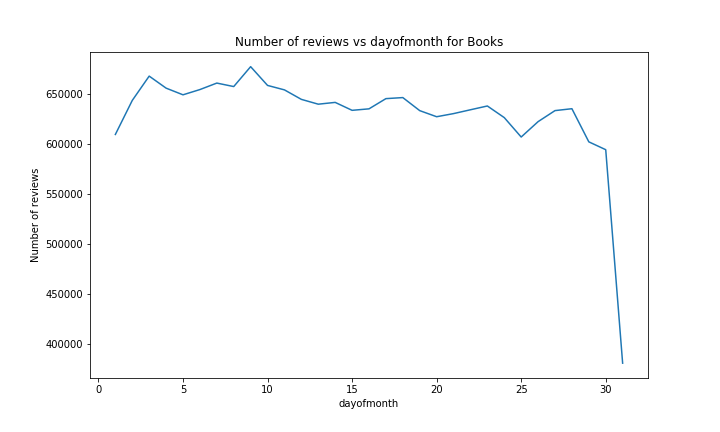
For the day of the month, the confidence bands are almost too big to draw significant conclusions. We could however argue that people usually receive their salary at the end of the month, therefore are more happy and give better ratings in the following days, with their happiness decreasing until the next payday. The number of reviews is very low on the 31. This is not something worth interpreting, as almost all months have at least 30 days, but only a few have 31. The slight decrease in the number of reviews over the month might be connected to the previous argument of payday happiness, where people might spend more money to buy products on Amazon at the beginning of the month, hence give more reviews. The effect on the average rating we observe is about 0.02.
When comparing with the other categories, it is once again hard to trust this theory, since the effect varies a lot from one category to the other.
Nevertheless, wether those biases are due to minor randomness, changes in humor or changes of trend in the users’ way of rating along the years, we will try to correct them.
Analysis of the number of reviews per product
Here, we want to see if there is any trend between the total number of reviews on a product and the rating of that product. We decided to only keep products with more than 2 reviews, since it is reasonable to assume that the average rating of products with a small amount of reviews might not be that reliable as an indication of the true quality of the product.
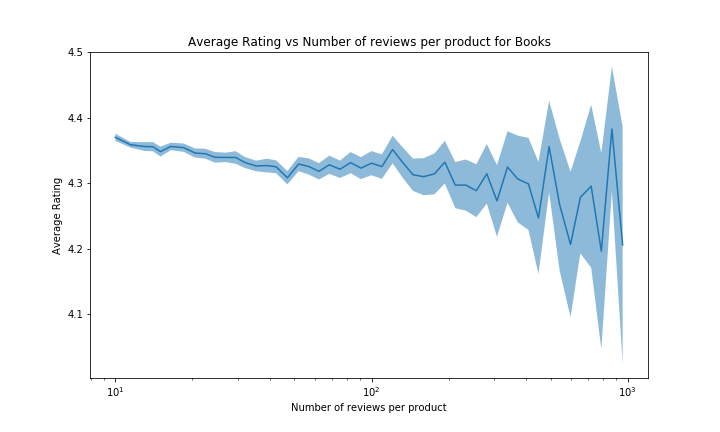
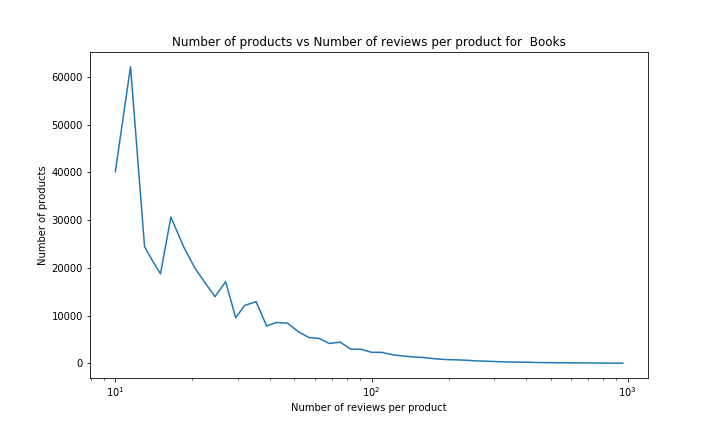
There seems to be a trend between the two, but as the number of reviews per product increases, we have less and less data and the confidence interval becomes larger. This makes sense, as we can expect the number of reviews to be highly positively correlated with the number of sales. It is quite intuitive that only few products are very popular and many products are not so successful (the number of reviews is intuitively highly correlated with the number of sales).
So we can observe for sure a descending trend in the average rating between 3 and ~100 number of reviews per product (of about 0.05 stars, which is not negligable with so much data) but any value after that becomes too uncertain to conclude anything. This is hard to come with a good explanation for this phenomena, so we will not try to correct this value as we cannot identify if this a bias to be corrected or due to other factors.
Analysis of the review_headline and review_body features
Another feature that may give us a hint on the rating is the review’s text. A method that comes to mind would be to analyse the text with natural language processing models, especially sentiment analysis. But this analysis would not bring new insights, if we were to find a positive correlation. It would seem fairly intuitive that a more positive review will come with a higher rating. This would also be too computationaly expensive considering the amount of data we have. Of course there are always exceptions, often from people that don’t understand the principle of stars…

Therefore we decided to go with features that are easier to extract. We chose to use title and text length. The reasoning would be that there is not much to say if the product is perfect, but one can explain at length why the product is not good.
Firstly, the title length:
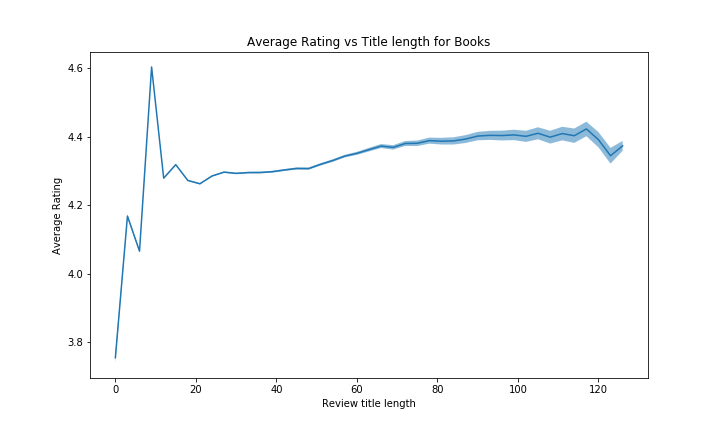
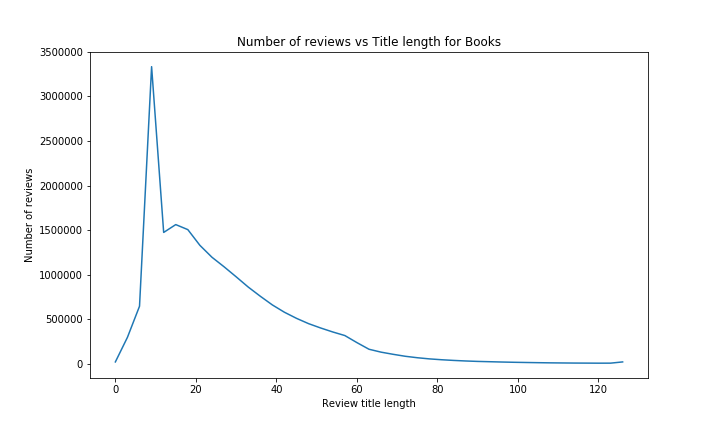
We have a huge peak for reviews with a title length of aproximatly 10 characters. This might be because a lot of people that liked their products put simple titles such as “very good”, “I recommand”, “best product”, and so on (or even possibly default titles proposed by Amazon). Reviews with very small titles have lower grades, maybe people that don’t like product don’t care about the title and just put the negative comment, but this there is a very low number of those reviews it is harder to tell with good confidence.
Overall however, we see that the average rating increases quite a lot for longer titles (more than 0.1 stars), probably because people that liked the product take some time to make good titles that might catch the attention of other people.
For the number of reviews, this result is expected. Most of the people make short title, whith very few making extremly short titles (hard to do a title in 3 letters), and few make very long title. (Most “normal” people will write their opinion in the review body instead, those that write essays as their titles might be the same that don’t understand how stars work…)
If we look deeper at reviews with a title of length 10, in particular the 7 most common titles, we see something extepected:
| review_headline | count |
|---|---|
| Five Stars | 1380977 |
| Four Stars | 226379 |
| Great book | 62192 |
| Great Book | 53497 |
| great book | 25645 |
| Excellent! | 16354 |
This confirms our intuition. Most of the people that liked the product can put a simple adjective / the number of stars, to quickly say what they think. For negative reviews, this would be harder, at least if you want to give a constructive review.
Now, for the review body length:
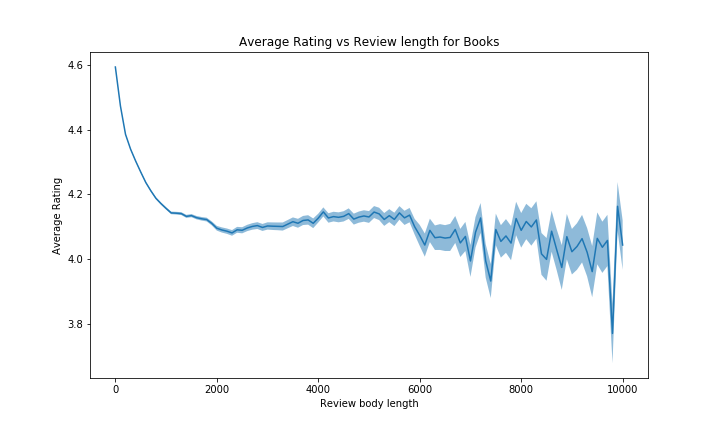
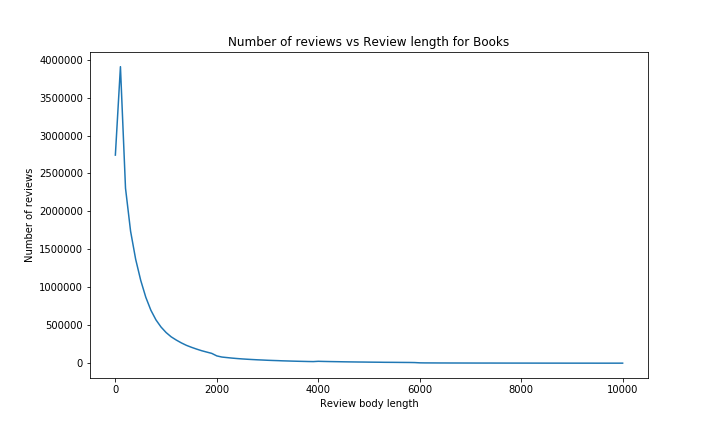
For the body length however, we see that the result is completly different. A short review body generaly corresponds to a higher rating, whereas a long review coresponds to a lower rating. It probably is because there is not always much to say for excellent products, whereas you can describe a lot of negative points for the less good products. That trend is very clear between 0 and 2000 characters, with a huge drop of more than 0.5 stars, but for longer reviews, it is harder to conclude anything since the confidence interval is much larger, and we can see a lot of noise. That is obvisously due to the small quantity of reviews with more than 5000 characters (people rarelly will spend so much time writting reviews).
While being an interesting analysis, it will not be used in bias correction as the title and body length are naturally correlated with the ratings and it makes perfect sense.
By Country
In this part, we want to see if there are any differences between the way people rate articles in differents countries. As a reminder, we have data for the United States, the United Kingdom, France, Germany and Japan
To be able to correcly compare ratings between countries, we will have to limit our dataset to products that are available in both regions. Moreover, we will only keep reviews given during the same time period, since we saw earlier that the year of the review had quite a big impact on the rating.
e.g. If for a given article we have reviews from 2001 to 2015 in the US, but only from 2005 to 2015 in the UK, we will discard all reviews in the US before 2005.
We did pairwise comparaisons, since it is the way we have the most common data. You can see here the repartition of ratings in the US (on the left) versus the other countries (on the right).
We see that there is no significant difference of the ratings between countries. Our boxplots show that there is indeed a difference in the median, but the intervals are too large to confidently conclude anything. In France, Germany and Japan, there are products with lower average grades, but there does not seem to be a consistent bias present. We will therefore ignore this bias for the rest of our analysis.
Herding Behavior
One of the bias that might affect the ratings is what is called the Herding Behavior. Basically, for the same product, depending on the first review given to it, other reviews will vary. If the first review is very positive, other reviewers might have a tendency to also put a higher grade. The same is true for a first negative rating. If we want to make some analysis and give some hypotheses about this, we will need enough data, i.e. enough common products with a non negligable rating difference between the two countries. We have 29507 common reviews between the US and UK, which is not that much compared to the size of previous data, but we think it is still enough to see if this effect is indeed real.
Approach
We will create a scatter plot, with on the x axis the difference between the first rating in both markets, and on the y axis the difference in average of all ratings. We exclude the first vote for the average calculation since it could affect the average. For example if it was significantly lower, and there would not be many votes, it could pull the average down. We will also only include products with at least 5 reviews, since we want to exlude any potential randomness due to such a low amount of reviews.
If there was no herding behaviour effect, we would expect a uniform cloud centered at $[c_{avg},c_{avg}]$, where $c_{avg}$ is the average country difference. Since we did not observe any signifcant bias in the last section, we expect this value to be roughly 0. If herding behaviour is present, we still expect a point cloud centered at $[c_{avg},c_{avg}]$, but there will be a positive correlation between the first rating and the average rating.
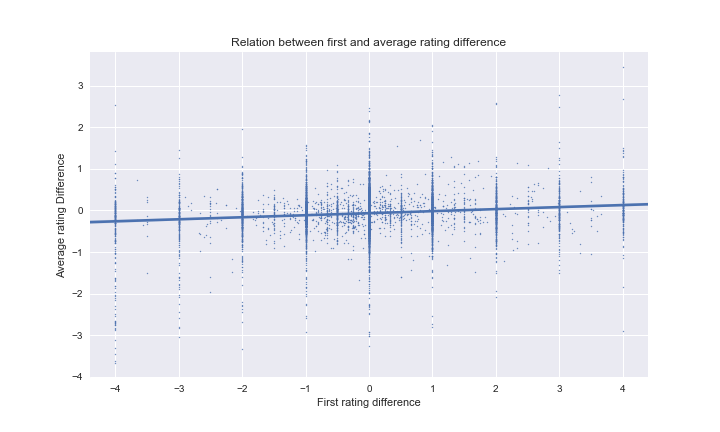
We see that there are some samples where the first vote is not a whole number. This is because the date does not contain hour and minute, so sometimes there are multiple ratings occuring on the first date. Our algorithm calculates the average of those.
In order to avoid this, we filter our resulting dataset to only contain integer first votes. (Sometimes we will probably include datapoints where the multiple first-day votes average to a whole number, but this is very unlikely with increasing number of first day votes)
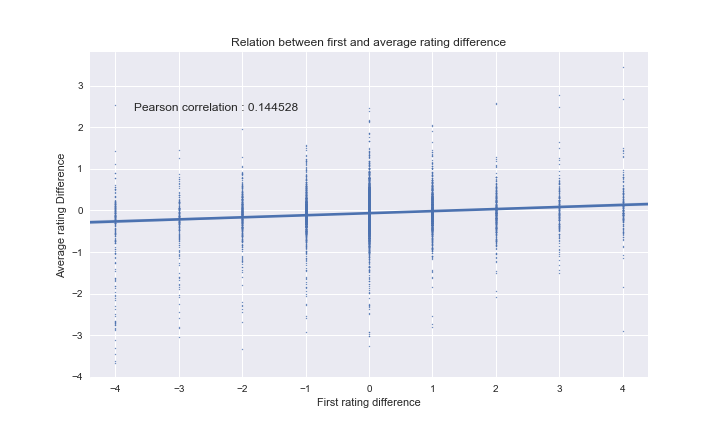
Visual inspection of the regression slope shows that it is strictly positive. The confidence bands of the seaborn plot do not include a line $f(x) = c$, so we can conclude that there is herding behaviour. Moreover, we see that we have a Pearson’s correlation coefficient of ~0.145, which is quite low, but significant and expected. If it was bigger, for instance 0.8, it might actually really problematic for Amazon, and would mean that the vast majority of people would just look at older reviews, without giving their own opinion at all. Hence this is a good thing to have quite a low correlation.
One question that follows from this is if this correlation also depends on the number of reviews for a product.
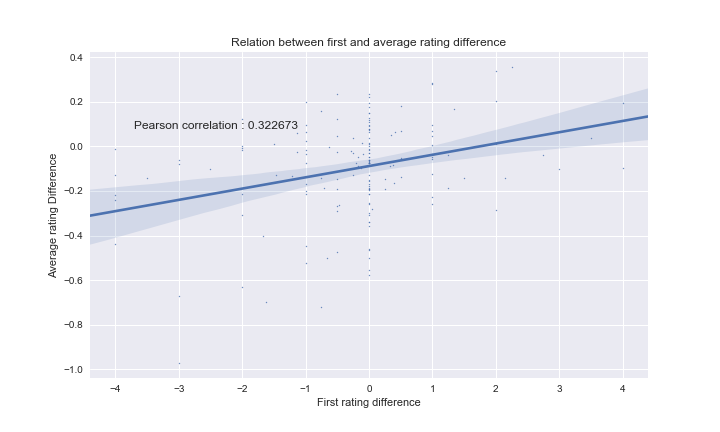
Here, we only used products that have between 100 and 300 reviews. We can clearly see a higher correlation, with a Pearson coeeficient of 0.323. There is more incertitude, due to the smaller amount of data, but we can confidently say that the effect is greater. We thought that it might be correlated to the number of reviews for a product, but after more experiments for products with higher (and lower) amounts of reviews, we could not find any relation.
To better understand what is really happending, we looker deeper into a few products. For each of them, we plotted the commulative average of the reviews written in both the US and UK, relative to the date. The first review was excluded in this cummulative average.
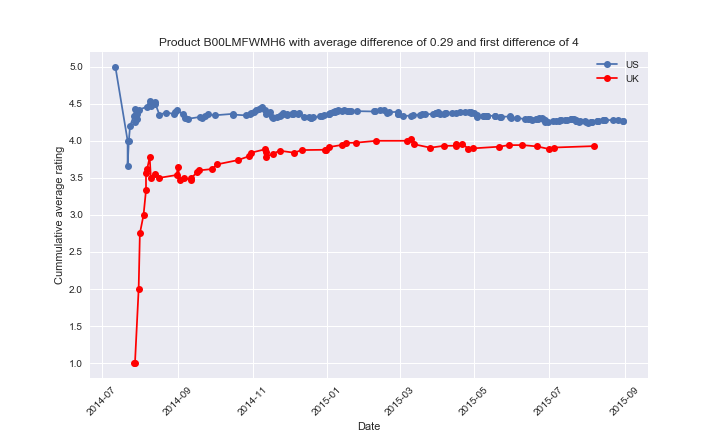
Here, we see that the first review has a huge difference of 4 stars between the countries. The average difference then shrinks substantially, but even after a lot of reviews the difference is still of ~0.3 stars. The first few bad rating in the UK are quickly compensated by the next reviews, but those reviews are nevertheless pulled down by the first one. The next ones will then be pulled by the previous grades, and so on, so the averages might never converge, or only after a very long time.
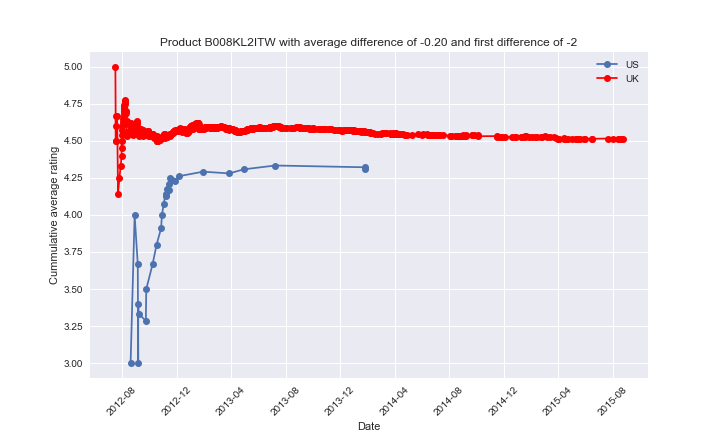
Here, we observe a similar effect, but this time the US first rating is lower, leading to a lower average rating.
Finally, it is important to note that these “nice” examples are quite rare (hence the 0.145 as the correlation). For the majority of products, either we don’t have any clear separation of the averages, or it is actually the opposite effect that is observed.
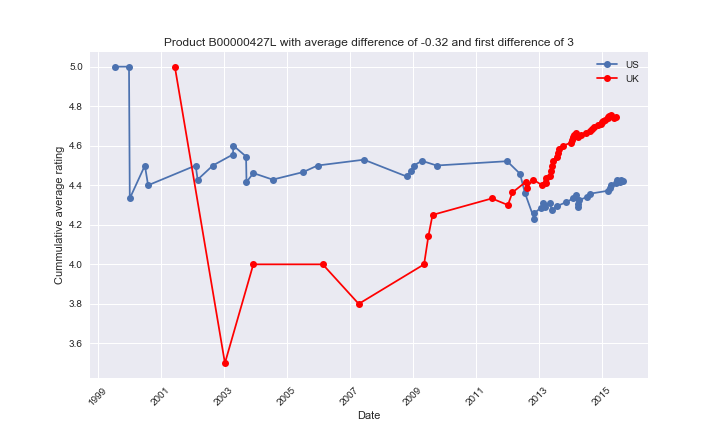
Here we can see that the averages keep moving up and down, and that the initial difference (3) is of the opposite sign than the product final average rating (-0.32). Note that the time range is really large, so it might also have an effect (Maybe very old reviews are not shown as much, so the herding behavior will be less important).
Overall we can say that there is indeed a herding behavior with Amazon reviews. It is quite small, which as explained before makes sense. But since there is so much variation from one product another, and many different factors other than the herding behavior that might affect the average, it will be ignored for our bias correction. We found for instance a DVD that had 4.7 stars in the US and 2.1 stars in the UK; the herding effect was clear, since the first rating also had that difference, but the bad rating was actually due to the fact that the DVD was not compatible with Britsh TVs (=> The PAL vs NTSC video format encoding was the problem.).
That makes it harder to know if the effect is actually due to the herding behavior, or just to the worse quality of the product in one of the country (as well as any other unkown factors). For all of these reasons, we decided not to use the effect in our bias correction.
3. Bias Correction
Decisions
As a conclusion from the above results, we will correct for the bias of specific users and for the bias of time. We saw that herding behaviour is an important effect, however it is difficult to quantify and calculate the unbiased rating.
Correction by Date
As discussed previously, we will try to remove time related bias. To do that, we will correct each rating by increasing/decreasing its value depending of which time period it has been made (how far from the average rating it is). We correct the reviews according to the 4 types of time period seen before; by year, by month, by day of the month and by day of the week. The results shown are after having corrected all of these 4 biases.
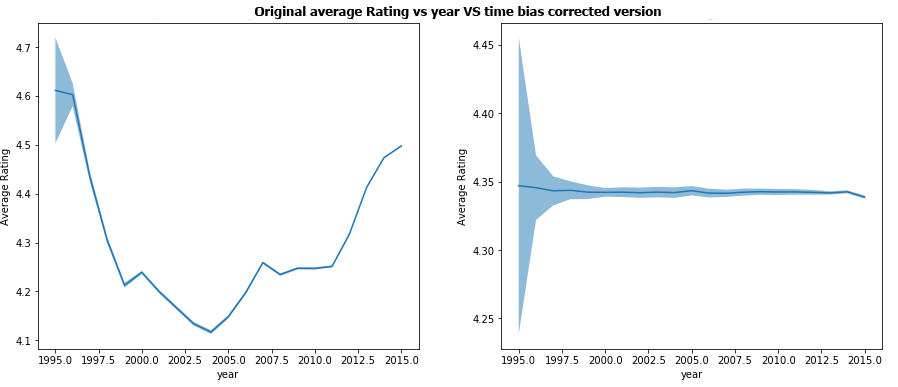
The correction by years seems to be able to fix really well the biases. Note that it was also where the biggest biases where seen so even if further results of the other types of time period do not give such good results, this bias correction will still have been very significant! When reading the graphs, have a look at the axis as y scale is not the same on the corrected graphs.
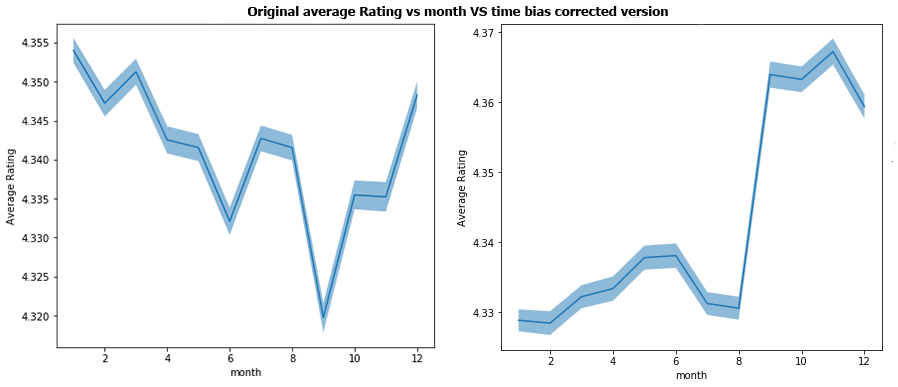
For months, the bias increased slightly, and wasn’t on the same months anymore. It may be due to a high correlation between the year and month and that correcting year biases changed the month biases. Since the bias is still small, it will not be that important compared to the year bias.
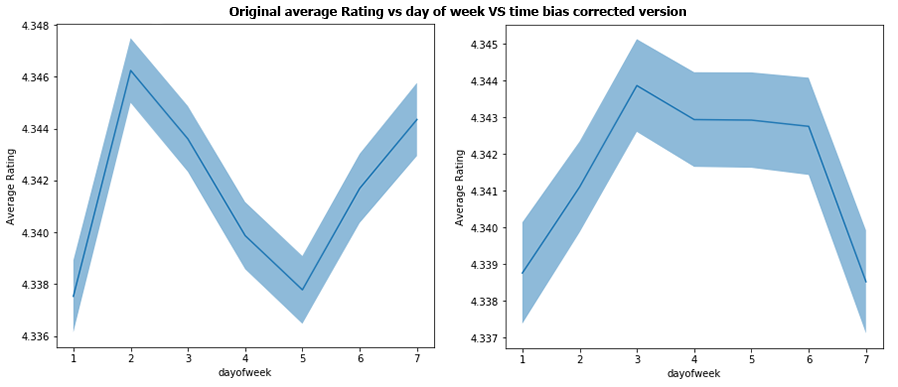
For the day of the week, we have almost no change in the range of the bias, maybe a tiny bit smaller. But the bias was already really small initially.
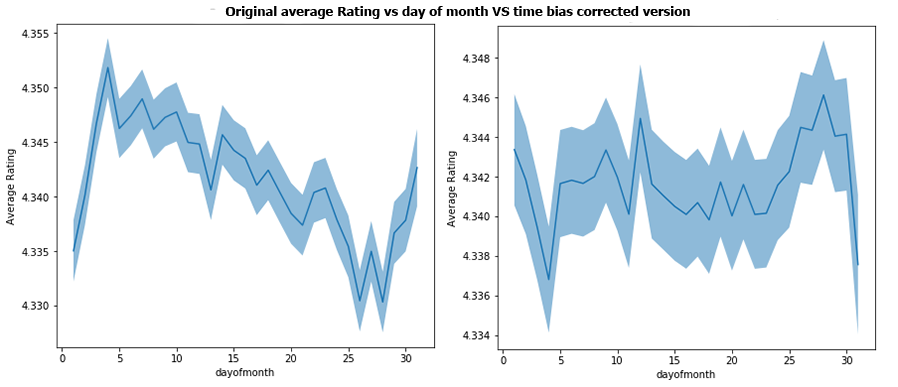
Finally, for the day of the month, the range of the bias went down from about 0.025 to 0.012. So even though the bias was quite low we made a small improvement.
Overall, the time correction seems to have worked well, correcting the biggest biases in the years analysis and doing little or no change on the other time scales where the bias was way smaller anyways. Hence we can say it is quite conclusive.
Correction by User History
Now that we corrected the time bias, it is time to find a way to correct potential user bias. The method we used previously was logical and was made with a goal in mind: not having any more bias after the correction. However, it is not as simple to correct the bias correction, as we will not have a way to check if the final result in correct. We nevertheless think that our idea makes sense, and should be quite correct, although maybe a bit simple.
We will correct the users bias using the following formula:
\[ corrected\_rating = actual\_rating + \alpha \cdot (avg - x) \ \ (1)\]
where
\[ \alpha = 1 - (helpful\_ratio \cdot (1 - \exp(-lambda \cdot total\_votes)) \ \ (2)\]
and if the review is not verified, we change alpha to be
\[ \alpha_{new} = \alpha + (1 - \alpha) \cdot 0.5 \ \ (3)\]
x is the average rating for the user that wrote the review and avg is the median of all the users’ average rating, lambda is a tuning parameter that we set to 0.25.
This will have the following effect:
- We will correct a users bias. If a users average grade is higher than the average overall grade, then this user is classified as giving too high grades, therefore we will decrease the grade he gave slightly. This is computed by (avg - x).
- alpha is a coefficient from 0 to 1 controlling the strength of the correction applied.
- If the review is deemed helpful by many people, many people agree with the rating and we will correct it less.
- If the reviewer has not given many reviews yet, we will not correct his rating that much since we cannot estimate his bias very well.
- If the review is not verified, we increase the alpha as the review should be less trusted and hence given less importance. This increase will be of 0.5 if alpha was 0 beforehand and linearly decrease to be of 0 if alpha already was at its max value of 1.
With the date bias and user bias correction implemented, we were ready to try our algorithm. We run it on a few articles, you can see right here some of the results. For the first product, we show the average product rating, as well as all the individual reviews rating.
Hands-On Chemistry Activities with Real-Life Applications: Easy-to-Use Labs and Demonstrations for Grades 8-12
| Original rating | Time bias corrected | User (& time) bias corrected |
|---|---|---|
| Individual product reviews | ||
| 5.000 | 5.080 | 5.499 |
| 5.000 | 5.126 | 4.979 |
| 5.000 | 4.887 | 4.760 |
| 5.000 | 4.930 | 4.859 |
| 5.000 | 5.104 | 5.007 |
| 5.000 | 4.869 | 4.524 |
| 5.000 | 4.861 | 4.418 |
| 2.000 | 1.931 | 3.582 |
| 5.000 | 4.932 | 4.488 |
| 5.000 | 5.125 | 5.103 |
| 5.000 | 4.959 | 5.582 |
| 5.000 | 5.105 | 5.372 |
| 5.000 | 5.229 | 5.000 |
| 3.000 | 2.860 | 3.667 |
| 5.000 | 4.911 | 4.468 |
| 5.000 | 4.920 | 4.843 |
| 5.000 | 4.847 | 4.403 |
| 5.000 | 5.136 | 5.629 |
| 5.000 | 5.134 | 5.303 |
| 5.000 | 4.834 | 4.890 |
| Total product average | ||
| 4.750 | 4.739 | 4.819 |
A few more examples, with only the average rating:
| Product name | Original rating | After time bias corrections | After use bias correction |
|---|---|---|---|
| ShowTime Popular: Level 2A (Showtime Piano) 0 | 4.800 | 4.711 | 4.485 |
| Mad for Decades: 50 Years of Forgettable Humor from MAD Magazine | 4.250 | 4.195 | 4.252 |
| Pearson Nurse’s Drug Guide 2011 | 4.450 | 4.484 | 4.570 |
| Not a Suicide Pact: The Constitution in a Time of National Emergency (Inalienable Rights) | 3.750 | 3.851 | 4.289 |
| A Darwinian Left: Politics, Evolution, and Cooperation | 3.700 | 3.816 | 4.049 |
4. Conclusion
Summary
There are a lot of modifiers that influence the rating of a review but this is not easy to tell whether this is due to a bias or some hidden variable. However, once we detect biases, removing them works quite well. Furthermore, it is sometimes difficult to say in what proportions to correct thoses biases and require the use of arbitrary parameters.
Hence, we can easily correct bias but it is hard to tell what are the biases and how much to correct them as it is quite subjective.
Further Possible Work
There are 2 possible ways to extend this model.
Firstly, we could extend the number of features used for correction by including herding behaviour, international ratings and more text based methods to correct individual reviews based on the review text. We could also have used some features, such as the product price, the product image or the “also bought” list, by getting them from Amazon ourselves.
Secondly, a different correction model may be used. We used a formula for correction that is based on our findings in the bias analysis, but one could try to use a learning based approach. For example a supervised learning task could be used to predict the “true” score. The problem however would be to create the “true” responses for training. Perhaps, an expert group could be used.
Usefulness
We showed that amazon reviews have significant biases. We propose a method for correcting this bias. This method could be used for vendors to better understand the reviews they get. We do not recommend to use this method for correcting reviews displayed to the user. Doing so would pose two possible problems:
Ethics/User Satisfaction Amazon users will be displeased if they would notice the bias correction techniques proposed here were used. They could understand the bias correction as amazon telling them “I know better what grade you would have given, your feelings are wrong”. This could result in a backlash against amazon. Also, a prospect buyer will probably spend the time to read some of the reviews and would therefore notice any biased reviews (which we try to correct).Therefore for the general user this method is not really necessary. A vendor however, who wants to statistically evaluate his products and does not have the time to read the reviews could find our method useful.
Danger for abuse
Similar to google search optimisation, vendors and fake reviewers or haters could abuse our correction if they knew how it worked. For example if one would want to give a positive review, one could give 5 stars on a day that has a very low average review. We would then correct this daily “bias” and make the review even higher. Also, our user correction could be abused. To get very high reviews, one has to vote 1 star on many products in order to bring the users average rating down, and rate 5 start on our product. The bias correction algorithm would increase the grade as the user usually gives low reviews.
The inverse tactics can be used to give very low reviews.
Hence we see that our bias correction system, despite its usefulness should be used with caution.